

Wondering what Excel skills should I learn first? Discover the essential beginner skills to master Excel quickly. Learn basics like navigation, data entry, formulas, and charts to build a strong foundation. Excel is one of the most useful tools in today’s digital world. You can use it to manage money, study business data, or organize school projects. Learning Excel can change how you work with information and make decisions.
Still, many beginners feel confused when they open Excel. With so many tools, buttons, and features, it’s hard to know where to start. But don’t worry! This easy-to-follow guide will show you the best Excel skills to learn first. These basics will help you feel more confident and ready to grow your skills over time.
You don’t have to learn everything at once. Focus on the most useful tools first. That way, you can start using Excel right away and get better step by step.
Let’s explore what you need to know to build a strong Excel foundation that will help you now and in the future.
Must Read: What Is a VLOOKUP in Excel? – Simple Guide for Beginners
Why Excel Skills Matter More Than Ever
Excel isn’t just for making tables—it helps you understand and work with data. In today’s world, knowing how to use Excel is as important as knowing how to use a computer was 20 years ago.
If you’re managing your money, Excel helps you track spending, plan budgets, and see where your money goes. In business, people use Excel for simple math and complex financial plans. Students and researchers use it to organize and study data.
You don’t need to learn everything all at once. The smart way to get good at Excel is to start with the basics that help most. This way, you can use Excel to do useful things right away.
As you practice and learn more, you’ll be able to do even more advanced tasks. A strong start will help you feel confident and make learning Excel easier as you go.
Mastering the Excel Interface: Your Digital Workspace
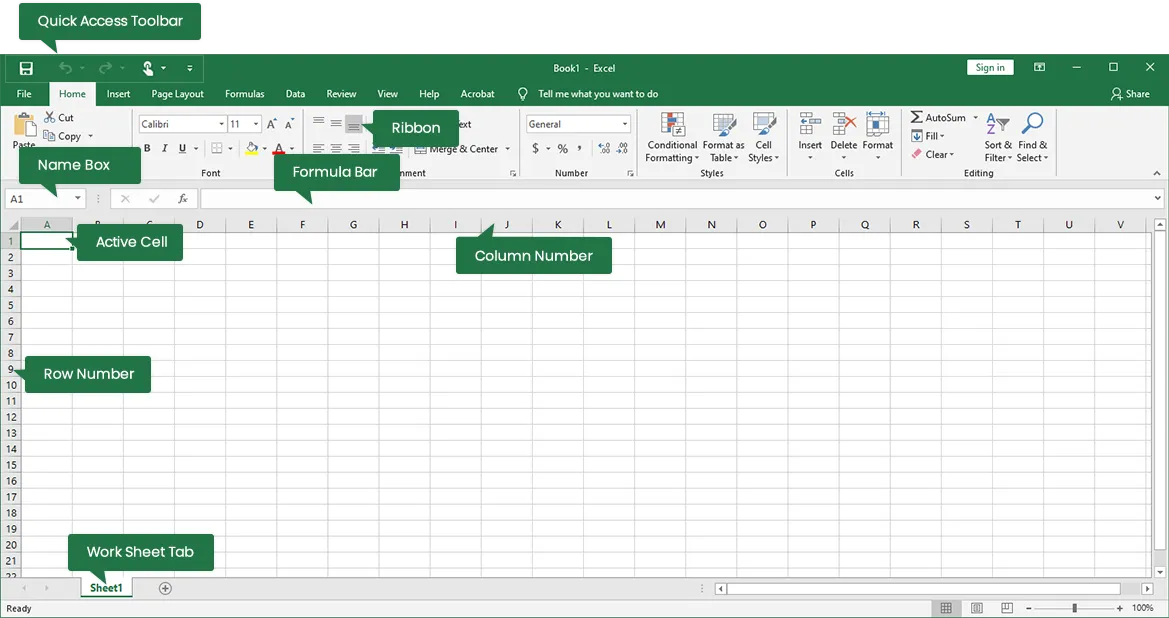
Understanding the Ribbon System
The ribbon is the main menu at the top of Excel. It has tabs like Home, Insert, Data, and Formulas, each with groups of tools.
The Home tab has tools you’ll use most, like font styles and number formatting. The Insert tab lets you add charts or images. As you learn more, the Data tab becomes helpful for sorting and analyzing. The Formulas tab gives you access to math and function tools.
Each tab is grouped in a way that makes sense. Once you understand how they’re arranged, Excel becomes easier to use.
Take a little time to click through the ribbon tabs. Learning what each one does now will help a lot as you get better at Excel.
Worksheets, Workbooks, and Cell Navigation
Excel is set up in layers. Cells are inside worksheets, and worksheets are inside workbooks. A workbook can have many worksheets to keep your work organized.
Each cell is named by its column letter and row number—like A1 or B2. The Name Box shows the cell’s name, and the Formula Bar shows what’s inside it.
Practice moving around with both the mouse and arrow keys. Keyboard shortcuts can be faster, especially when working with lots of data.
Essential Data Entry Techniques
Entering data is the first thing you’ll do in Excel. You can type in text, numbers, or dates. Excel usually figures out what type it is, but knowing how to format it helps avoid mistakes.
AutoFill lets you copy patterns fast—like dragging numbers or dates. It saves time.
Use copy, cut, and paste to move data. Try Paste Special for more control, like pasting just values or formats.
Data Organization and Presentation: Making Information Accessible
Cell Formatting for Professional Appearance
Good formatting makes your data easy to read. Choose fonts, sizes, and colors that look clear—not flashy. Using the same style throughout your sheet makes it look neat and trustworthy.
Use bold for titles and key info. Italic is great for notes. Only use underlines when really needed, like in accounting.
Add borders and background colors to make parts stand out. Light colors can help you spot headers or groups of data without being too bright. Borders help separate sections and keep everything clear.
Number Formatting for Clarity
Formatting numbers the right way helps people understand them. For example, money should show $ signs and decimal places. Percentages should have the % symbol. Dates should appear in a format you like.
The Accounting format lines up numbers and puts negatives in parentheses—this is standard for financial sheets. You can also create custom number formats if needed.
Make sure your numbers look the same all over your sheet. This makes it easier to read and looks more professional.
Workspace Management Techniques
Change column widths and row heights so all your data fits. Double-click a column edge to make it fit the text, or drag it to size it your way.
Use Freeze Panes to keep headers in view while scrolling. You can freeze the top row or first column so labels always stay visible.
Sorting helps you put data in order (like A–Z or smallest to largest). Filtering lets you show only the info you want. These tools help you quickly find answers and spot patterns.
Essential Formulas and Functions: Excel’s Calculation Engine
Understanding Formula Basics
All formulas in Excel start with an equals sign (=). This tells Excel to do a calculation, not just show text.
You can use simple math symbols:
+ for adding,
– for subtracting,
*** for multiplying,
/** for dividing,
^ for exponents (like powers).
These follow math rules. Use parentheses ( ) if you want to change the order. For example:=(A1+B1)*C1 adds A1 and B1 first, then multiplies the result by C1.
You can do lots of math in one cell. This helps avoid making extra steps in your sheet.
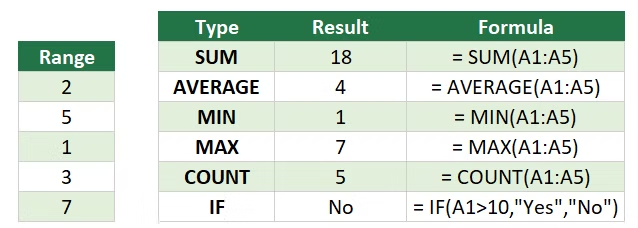
The SUM Function: Your Most Important Tool
SUM adds up numbers quickly. For example:=SUM(A1:A10) adds everything from A1 to A10. It skips empty cells, so it’s safe to use.
You can also pick different cells:=SUM(A1, C1, E1) adds only those.
It works with both numbers and formulas. If a cell has a formula, SUM uses its answer. That means it can work with more complex calculations, too.
Statistical Functions for Data Analysis
AVERAGE finds the mean (average):=AVERAGE(A1:A10) adds them all and divides by the count. It skips blanks and handles mixed types smartly.
MIN and MAX show the smallest and largest values in a list. Use these to check your data or find highs and lows. You can even highlight them using color rules.
COUNT tells how many cells have numbers.
COUNTA tells how many cells aren’t empty.
Use the right one to avoid mistakes.
Cell References: Relative vs. Absolute
Relative references like A1 change when copied. This helps when doing similar formulas across rows.
Absolute references like $A$1 stay locked, even when copied. Use these when you always need the same cell.
Mixed references ($A1 or A$1) lock either the row or column. These are handy in more advanced formulas.
Data Analysis and Visualization: Transforming Numbers into Insights
Excel Tables: Structured Data Management
Turning a group of cells into an Excel Table makes working with data easier. Tables grow automatically when you add new info and keep your formatting and formulas.
Table headers stay visible when you scroll, so you don’t lose track of what each column means. Tables also use column names in formulas, making them easier to read.
You can sort and filter data quickly in a Table. These tools help you explore and understand the data better.
Tables also look better with built-in styles. You can choose a design with alternating row colors and clear borders. This makes your spreadsheet easier to read and more organized.
Basic Charts for Visual Communication
Column charts are great for comparing data, like sales by product or scores by student. The bars show differences clearly.
Line charts are good for showing changes over time. Use them to track things like monthly expenses or grades. You can even add more lines to compare different things.
Pie charts show parts of a whole. They’re okay for showing a few categories, but they can get messy. If you have a lot of items, a bar chart might be better.
Conditional Formatting: Highlighting Key Information
Conditional formatting changes the look of cells based on their values. For example, you can highlight numbers that are too high or too low.
Use Top/Bottom Rules to spot the highest and lowest numbers fast. This is great for finding outliers or best/worst performers.
Color scales show how values compare, and data bars add little charts inside cells to make numbers easier to understand at a glance.
These tools help you see important data right away.
Practical Applications: Real-World Skill Development
Personal Budget Management
You can use Excel to make a monthly budget. Track your income and spending in different categories. Use the SUM function to total your income and expenses. Then subtract to see what’s left.
Use conditional formatting to highlight spending that goes over the budget. This makes it easy to see problem areas.
You can use line charts to watch your spending over time. Column charts help you compare what you planned to spend vs. what you really spent. These charts help you understand your habits.
Use AutoFill to copy your budget setup from one month to the next. Then just update the numbers. It saves time and keeps things organized.
Simple Inventory Management
Track products, how many you have, and what they cost. Multiply the quantity by the unit cost to get the total value. Use SUM to get totals for groups of items.
Use conditional formatting to show items that are running low. Set a rule to color items when they fall below a certain number. This helps you know when to reorder.
Make simple charts to show what’s in your inventory. You can see the value or amount of different items quickly. This helps you manage your stock better.
Academic Grade Tracking
Use Excel to track your grades. Multiply your scores by how much they’re worth. Add those together, then divide to get your final grade.
Use line charts to watch how your grades change over time. You can see what’s getting better or worse.
Use conditional formatting to mark low grades or top scores. This helps you know where to improve—or celebrate your wins!
Building Advanced Skills: Your Next Steps
Intermediate Functions Worth Learning
IF statements let you make choices in Excel. For example,=IF(A1>100, "High", "Low") shows “High” if A1 is more than 100, otherwise “Low.” This helps with sorting and decisions in your sheets.
VLOOKUP and XLOOKUP find information in tables. They help you look up data without searching by hand. These are great when working with big lists or combining data.
Pivot Tables summarize lots of data fast. They group, count, and calculate stats for you. Pivot Tables turn raw data into clear reports that help with business or school projects.
Learning Resources and Continued Development
Microsoft’s official Excel guides give you full details and examples. They update often to include new features. Start with the basics and then try more advanced stuff.
Online videos are a great way to learn visually. Many YouTube channels teach Excel step-by-step for free. Find teachers you like to make learning easier.
Practice is key. Download sample files and try exercises. Working with real data helps you learn faster and feel more confident.
Must Read: Can I Link Excel with Google Sheets? – Step-by-Step Guide
Conclusion
Learning Excel starts with understanding the basics and practicing step by step. Begin by getting comfortable with the interface and entering data. Then move on to formatting, formulas, and making charts. Each skill builds on the one before it, giving you a strong foundation for harder tasks.
Remember, becoming good at Excel takes time and practice. Don’t try to learn everything at once. Focus on skills that solve your current problems, and add new ones as you need them.
Knowing Excel well will help you in many parts of your life. Whether you want to manage money, analyze business numbers, or organize school work, Excel makes working with data easier and faster. Start with the basics, practice regularly, and watch your confidence grow.
Excel mastery isn’t about memorizing every function. It’s about learning how to think through problems and use Excel’s tools to find answers quickly. With these core skills, you’re ready to tackle more complex challenges and keep improving your Excel skills over time.
