
In today’s data‑driven world, Excel users often face a choice between two powerful tools: the classic Pivot Table and the more advanced Power Pivot. While both help you summarize and analyze data, they serve different needs and skill levels.
In this article, we’ll briefly introduce what each tool does, highlight when to use one over the other, and show you how picking the right tool can turn your raw data into clear, actionable insights—no matter how big your spreadsheet grows.
Perfect for beginners and seasoned pros alike, this guide will set you on the path to smarter, faster reporting in Excel.
Must Read: How to Create a Dynamic Chart in Excel: The Complete 2025 Guide
What Is a Pivot Table?
Imagine you have a big box of LEGO bricks sorted by color, shape, and size. A Pivot Table is like a magical sorting station that lets you group those bricks however you like: by color, then count how many of each you have, or by shape, then list average sizes. In Excel:
- You start with a normal table of data: rows and columns.
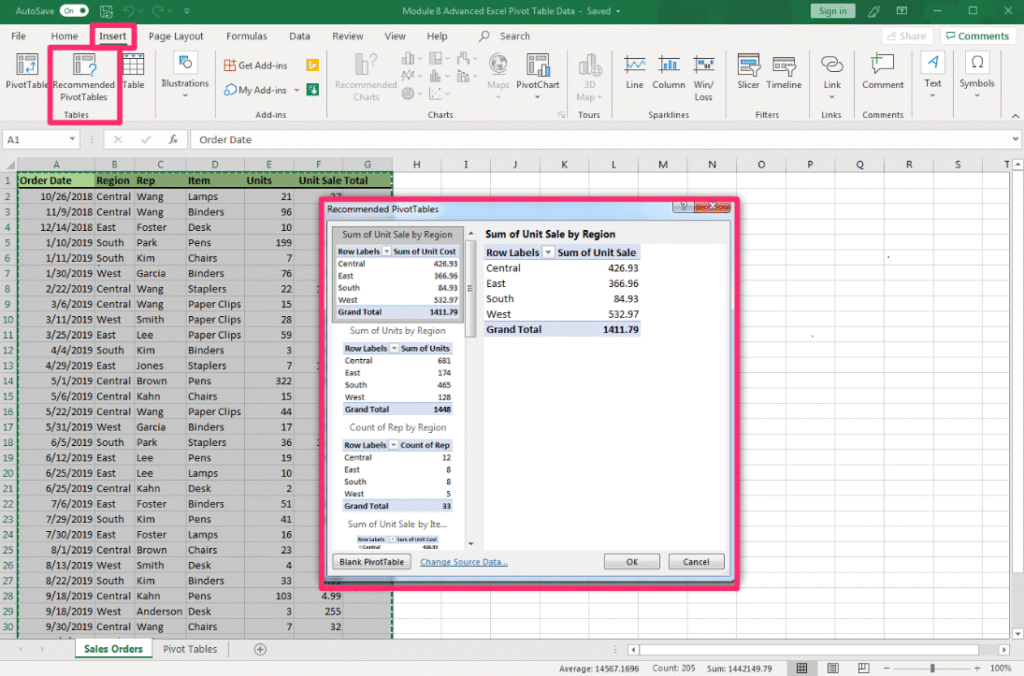
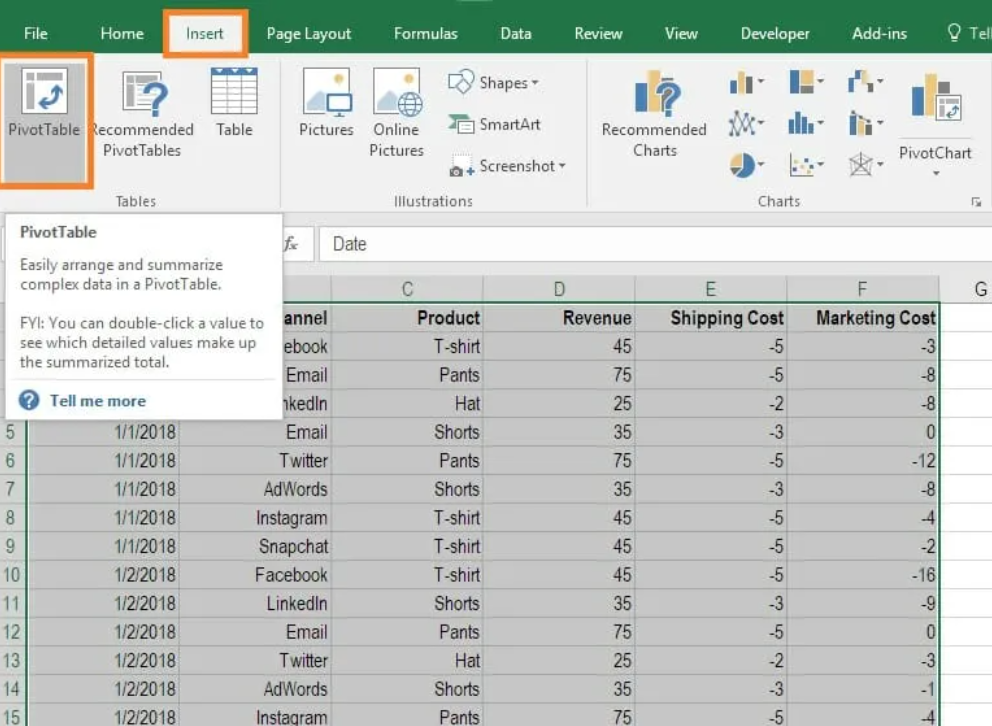
- You click Insert → Pivot Table.
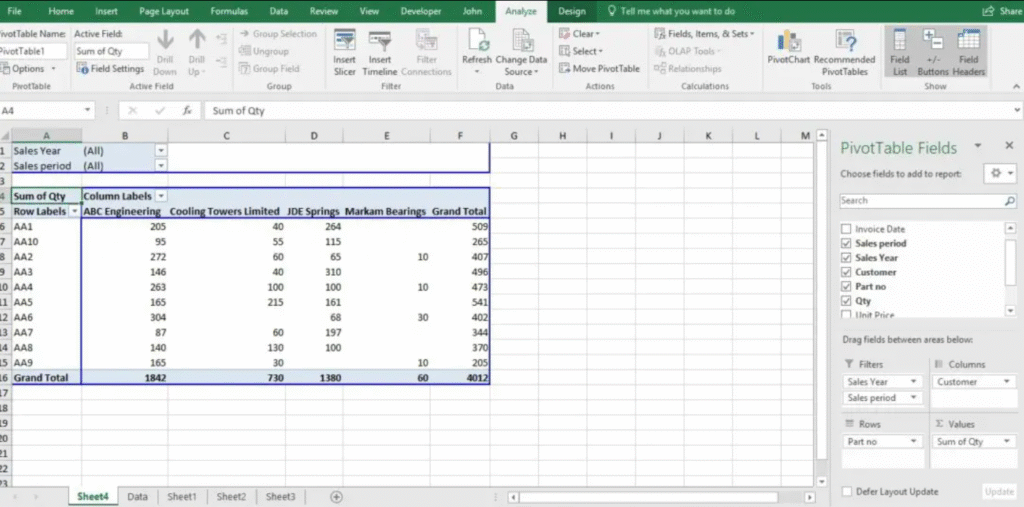
- You drag fields (column names) into areas like Rows, Columns, Values, and Filters.
Pivot Tables let you:
- Summarize data quickly (e.g., sums, counts, averages).
- Rearrange (“pivot”) data on the fly.
- Filter out what you don’t need.
- Drill down to see details.
Example:
You have sales data for an ice‑cream shop. A Pivot Table can show total sales per flavor, per month, or per store location, all in a few clicks.
What Is Power Pivot?
Now imagine you have multiple LEGO boxes—some with bricks, some with minifigures, some with instruction booklets—and you want to analyze them together.
Excel’s basic Pivot Tables struggle when you bring in many data sources or super large tables. That’s where Power Pivot steps in.
Power Pivot is an add‑in (built into Excel 2016 and later) that:
- Creates a Data Model
- Think of the Data Model as a big warehouse where you store multiple tables.
- Tables can come from Excel sheets, external databases, text files, or online services.
- Handles Huge Amounts of Data
- Can work with millions of rows without slowing down Excel.
- Builds Relationships
- Just like in a database, you can relate tables by common fields (e.g., linking Sales to Products).
- Uses DAX (Data Analysis Expressions)
- A powerful formula language to create custom calculations (e.g., running totals, year‑over‑year growth).
Example:
Your ice‑cream shop also has inventory data (ingredients, suppliers) in another file, and maybe customer feedback in a third. Power Pivot lets you bring all these tables into one model, define how they connect, and then build Pivot Tables or Pivot Charts on top of that unified model.
Key Differences Between Pivot Table and Power Pivot
| Feature | Pivot Table | Power Pivot |
|---|---|---|
| Data Source | Single table or range in a worksheet | Multiple tables from various sources |
| Data Volume | Up to ~1 million rows (Excel limit) | Handles tens of millions of rows via Data Model |
| Relationships | No true table relationships | Define one‑to‑many and many‑to‑many relationships |
| Calculations | Standard aggregations (sum, count, avg) | Advanced DAX formulas for custom measures |
| Performance | Slower with large data | Optimized in‑memory engine (xVelocity) |
| Ease of Use | Very easy; click‑and‑drag interface | Steeper learning curve (requires DAX knowledge) |
| Refresh | Refreshes from the sheet’s data | Refreshes Data Model from external sources |
Let’s explore these differences in more detail.
1. Data Source Flexibility
- Pivot Table
- Works with a single range or table in your workbook.
- Great when all data is neatly in one sheet.
- Power Pivot
- You can import multiple tables from databases (SQL Server, Access), Excel files, CSVs, and even online sources like Azure.
- These tables live in the Data Model but aren’t visible on worksheets unless you choose to show them.
2. Managing Large Data Sets
- Pivot Table
- Performance drops as you approach Excel’s row limit (1,048,576 rows).
- Filtering and refreshing can be slow.
- Power Pivot
- Uses the xVelocity in‑memory engine, which compresses data and keeps it in RAM for lightning‑fast calculations.
- Easily handles tens of millions of rows.
3. Creating Relationships
- Pivot Table
- Every time you want data from different tables, you’d manually VLOOKUP or INDEX/MATCH to bring them into one table.
- Power Pivot
- You define relationships (like database foreign keys) once in the Data Model.
- No need for messy lookup columns on sheets.
4. Advanced Calculations with DAX
- Pivot Table
- Built‑in functions: Sum, Count, Average, Max, Min, etc.
- Limited ability to create running totals or period comparisons without helper columns.
- Power Pivot
- DAX formulas let you build sophisticated measures:
- Time intelligence functions (YTD, MTD, QTD).
- Filtered calculations (e.g., only count blue bricks sold in Q1).
- Dynamic measures that adapt to any pivot arrangement.
- DAX formulas let you build sophisticated measures:
5. Performance and Scalability
- Pivot Table
- Click‑refresh each time; heavy operations can freeze Excel.
- Power Pivot
- Data is stored in a high‑performance in‑memory database.
- Even complex reports refresh quickly.
6. Learning Curve
- Pivot Table
- Intuitive interface; most users can learn in minutes.
- Power Pivot
- Requires learning DAX and the Data Model interface.
- Steeper learning curve but very rewarding for complex reporting.
What are the Three Types of PivotTables?
Excel actually offers three main types of pivot tables:
- Classic Pivot Table
- The familiar click‑and‑drag interface. Good for most tasks.
- Power Pivot–based Pivot Table
- When you build a Pivot Table on the Data Model (Power Pivot), you get advanced features like DAX measures.
- OLAP Pivot Table
- Connects directly to online analytical processing (OLAP) cubes or Power BI datasets. Use this for enterprise‑scale data warehousing.
Is Power Pivot Better Than a Pivot Table?
Neither tool is inherently “better”—it depends on your needs:
- Use Pivot Table when
- You have a single, small‑to‑medium table.
- You need quick ad‑hoc summaries.
- You’re looking for simplicity and speed of setup.
- Use Power Pivot when
- You need to combine multiple tables from different sources.
- You’re working with very large data sets.
- You require advanced calculations and dynamic measures.
- You want a more scalable, maintainable solution for reporting.
In short, Power Pivot extends Pivot Tables, rather than replaces them. If your analysis outgrows the basic Pivot Table, Power Pivot is the natural next step.
When Should I Use Power Pivot?
- Multiple Tables: You have distinct tables (e.g., Sales, Products, Customers) that share common keys.
- Large Data: You’re hitting Excel’s row limits or experiencing slow performance.
- Complex Calculations: You need running totals, time comparisons (year‑over‑year), or filtered measures.
- BI Integration: You plan to publish reports to Power BI or SharePoint.
- Data Refresh Automation: You want to refresh from external sources (SQL, Azure) automatically.
Which Pivot Is Best?
- For Advanced BI Solutions: OLAP Pivot Table or Power BI–connected Pivot.
- For Beginners or Simple Reports: Classic Pivot Table.
- For Intermediate Users: Pivot Tables on a small Data Model (Power Pivot.)
Must Read: How Can Excel Improve Productivity?
When to Use a Pivot Table vs. Power Pivot
| Scenario | Use Pivot Table | Use Power Pivot |
|---|---|---|
| Small to medium‑sized dataset (up to 100k rows) | ✔ | ❌ |
| Single table in the workbook | ✔ | ❌ |
| Quick ad‑hoc analysis or one‑off report | ✔ | ❌ |
| Combining multiple related tables | ❌ | ✔ |
| Handling very large datasets | ❌ | ✔ |
| Creating advanced calculations (time intelligence, etc.) | ❌ | ✔ |
| Self‑service BI solutions for non‑technical users | ❌ (might need helper tools) | ✔ (with well‑designed model) |
Advantages and Limitations
Pivot Table
Advantages
- Super easy to learn.
- Built into all versions of Excel.
- Great for quick, simple summaries.
Limitations
- Doesn’t handle truly large data sets well.
- No built‑in support for multiple tables/relationships.
- Calculations are basic.
Power Pivot
Advantages
- Handles large, complex data easily.
- Allows multiple tables and relationships.
- Extremely powerful calculations with DAX.
- Integrates with Power BI for seamless reporting.
Limitations
- Learning curve for Data Model and DAX.
- Interface is less intuitive than classic Pivot Table.
- Available only in certain Excel versions (Excel 2016+ or as an add‑in in 2010/2013).
Practical Example: Sales Reporting
Using a Pivot Table
- Copy all your sales data (Date, Product, Region, Sales Amount) into one sheet.
- Insert a Pivot Table.
- Drag Region to Rows, Date to Columns, and Sales Amount to Values.
- Watch summarised sales by region and month appear in seconds.
Great—but what if your product details (cost, category) are in a separate table, and supplier info in another? You’d need to merge them first, which can get messy.
Using Power Pivot
- Import the Sales table, Product table, and Supplier table into the Data Model.
- Go to the Manage Data Model window.
- Create Relationships:
- Sales[ProductID] → Product[ProductID]
- Product[SupplierID] → Supplier[SupplierID]
- In the Data Model, create a DAX measure for Gross Profit: cssCopyEdit
GrossProfit := SUM(Sales[SalesAmount]) - SUMX(Sales, RELATED(Product[Cost]) * Sales[Quantity]) - Back in Excel, insert a Pivot Table based on the Data Model.
- Drag Supplier Name to Rows, Region to Columns, and GrossProfit to Values.
Instantly, you see profit by supplier and region—no messy merging, no extra columns.
