

Is Excel compatible with Power BI? Many people ask this because they want to get the most out of their data. The clear answer is yes—Excel and Power BI work very well together. Both tools are made by Microsoft and are built to work as a team. When used together, they offer powerful ways to analyze and share data.
This guide will show you how they work together, why it matters, and how to get the best results.
Must Read: How to Collaborate with Others in Excel Online: The Complete Guide to Real-Time Teamwork
Understanding Excel and Power BI Fundamentals
What Makes Excel Essential for Data Work
Microsoft Excel is still the most popular spreadsheet tool in the world. Here’s why it’s so useful:
- Everyone uses it — Millions of people know how to use Excel.
- Flexible — Great for everything from basic math to big financial models.
- Detailed control — You can control each cell and formula exactly.
- Fast analysis — It’s easy to do quick calculations and simple charts.
- Common skill — Most workers already know how to use Excel.
Excel is great for personal work, small projects, and when you need full control of your data. But it isn’t the best for very large datasets or fancy dashboards.
Power BI’s Role in Modern Business Intelligence
Power BI helps companies do more with their data:
- Handles big data — Works with millions of rows, much more than Excel.
- Better charts — Creates interactive dashboards, better than Excel’s basic charts.
- Pulls in data from many sources — Connects different databases easily.
- Live updates — Works with cloud systems to refresh data automatically.
- Secure — Keeps data safe with advanced controls.
- Easy sharing — Lets the whole company access dashboards.
Core Integration Methods: How Excel and Power BI Connect
Importing Excel Data into Power BI Desktop
Power BI Desktop offers many ways to bring Excel data in:
- Direct connection — Import Excel files like .xlsx or .csv.
- Pick what you need — Choose specific sheets or tables to import.
- Keeps formatting — Power BI keeps data structure where possible.
- Makes suggestions — Helps you improve how data is imported.
- Works with Excel setup — Uses Excel tables inside Power BI.
This helps you bring in only the data you need, keeping the project running smoothly.
Cloud-Based Excel File Connections
Cloud storage makes Excel-Power BI connections even better:
- OneDrive works well — Simple connection through Microsoft’s cloud.
- Works with SharePoint — Easy for company-wide file sharing.
- Google Drive works too — With some setup, other clouds work fine.
- Automatic refresh — Files can update automatically.
- Good for teams — Helps everyone stay on the same page.
- Easy sign-in — Use your Microsoft login.
This avoids the old problem of needing to update files by hand.
Power Query Editor for Excel Data Transformation
Power Query Editor is a powerful tool for working with Excel data:
- Advanced tools — Combine, clean, and shape data.
- Custom columns — Use special formulas for advanced changes.
- Fix messy data — Clean up missing or wrong data.
- Save your work — Reuse queries for the next project.
- Faster loading — Power BI loads clean data quicker.
- Stay consistent — Use the same queries in different reports.
Exporting Power BI Data Back to Excel
The “Analyze in Excel” Feature
“Analyze in Excel” lets you use Excel tools on Power BI data:
- Live connection — Excel works directly with Power BI.
- Use Excel features — Build PivotTables and PivotCharts on Power BI data.
- Keeps security — Only shows data you’re allowed to see.
- Needs licenses — You’ll need Microsoft 365 and Power BI Pro.
- Auto updates — Changes in Power BI show in Excel.
- Familiar tools — You use Excel features you already know.
This gives you the power of Power BI with the comfort of Excel.
Data Export Options from Power BI Visuals
You can also export Power BI data into Excel files:
- Summarized data — Export what you see in a visual.
- Full data — Export all the data behind a chart.
- Many formats — Save as Excel or CSV.
- For all users — Share with people who don’t use Power BI.
- Snapshot option — Save data at one point in time.
- For records — Keep records for checking or compliance.
This helps share Power BI insights with a wider audience.
Excel Workbooks Within Power BI Service
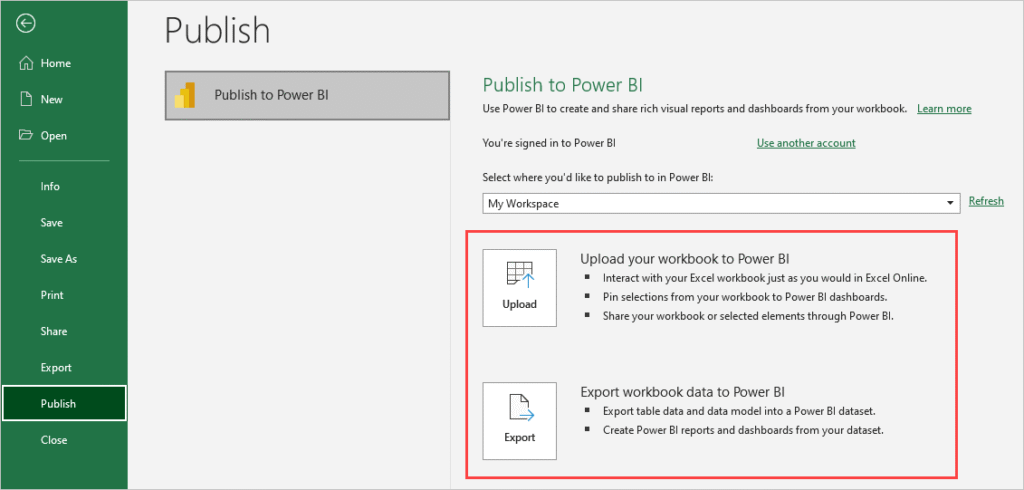
Uploading Complete Excel Workbooks
You can upload full Excel files to Power BI Service:
- Full upload — Bring in files with PivotTables and more.
- Import or display — Turn data into Power BI datasets or keep as Excel.
- Keeps Excel look — Your Excel file stays the same.
- Add visual power — Turn data into interactive visuals.
- Central access — Everyone can find the Excel files on the web.
- Supports all users — Works for both Excel and Power BI fans.
This works for both new and experienced Power BI users.
Scheduling Automatic Data Refreshes
You can set up Power BI to update Excel data on its own:
- Cloud file refresh — Works with OneDrive or SharePoint.
- Gateway needed — On-premises files need a gateway.
- Flexible timing — Refresh as often as needed.
- Fewer errors — No more manual update mistakes.
- Hybrid support — Works with cloud and on-premises.
- Always fresh — Your dashboards always show the latest data.
This turns old Excel reports into modern live dashboards.
Strategic Use Cases for Excel-Power BI Integration
Data Preparation and Initial Entry Workflows
Excel is great for starting data entry and prep work:
- Easy to use — People are comfortable entering data in Excel.
- Quick math — Use formulas to clean and prep data.
- Light cleaning — Fix small problems in the data.
- Smooth transition — Start in Excel, move to Power BI later.
- Keep skills — No need for new tools right away.
- No disruption — You can keep using your normal Excel process.
This makes it easy to begin using Power BI with what you already know.
Hybrid Financial Modeling Solutions
Together, Excel and Power BI are great for financial work:
- Excel is strong — Handles complex financial models.
- Power BI shows results — Great for interactive dashboards.
- Data links — Connect Power BI to Excel models.
- Clear reports — Share insights with managers.
- Budgeting — Excel does the math, Power BI shows the big picture.
- Department connection — Combine Excel models from different teams.
This combo helps finance teams work smarter.
Enterprise Data Consolidation
Power BI helps companies pull Excel data into one place:
- Brings data together — Combine Excel files from different teams.
- Single source of truth — Everyone sees the same numbers.
- Fixes problems — Catch errors in disconnected spreadsheets.
- Standard reports — Everyone gets the same version.
- Better control — Manage access and edits.
- Respect workflows — Teams can keep using Excel if they want.
You get a full view of company data without changing how teams work.
Self-Service Analytics Implementation
Together, Excel and Power BI let anyone explore data:
- Empowers users — People can analyze data on their own.
- Skill growth — Excel users slowly learn Power BI.
- Fewer delays — No need to wait for IT to run reports.
- Governed — IT still controls main data sources.
- Fosters creativity — Users can explore new insights.
- Faster training — Excel skills help users learn Power BI faster.
This creates a culture of data-driven decisions.
Maximizing Integration Benefits
Leveraging Existing Excel Skills
Building on Excel skills speeds up Power BI success:
- Skills transfer — Excel users learn Power BI quickly.
- Less training needed — Many ideas are already familiar.
- Smooth change — Add Power BI skills slowly.
- Lower resistance — Excel comfort helps with change.
- Similar formulas — Power BI’s DAX is like Excel functions.
- Concept overlap — Tables and relationships feel familiar.
This saves time and makes transitions easier.
Enhanced Visualization and Interactivity
Power BI improves how data looks and works:
- Interactive dashboards — Click to filter and drill down.
- Cool visuals — Maps, gauges, and more.
- Explore live — No need to create lots of sheets.
- Mobile-friendly — Dashboards work on phones and tablets.
- Team sharing — Dashboards can have comments.
- Looks great — Makes reports easier to read and present.
This turns plain Excel data into beautiful reports.
Scalability and Performance Improvements
Power BI handles large amounts of data better than Excel:
- Big data friendly — Can handle billions of rows.
- Faster — Quicker updates and smoother experience.
- Efficient — Uses memory better than Excel.
- Multiple users — Many users can work on the same data.
- Cloud-powered — Microsoft handles the heavy lifting.
- Complete analysis — No need to trim your data.
This helps businesses work with their full data history.
Best Practices for Seamless Integration
Structuring Excel Data for Power BI Success
To help Power BI, you should organize Excel data well:
- Use tables — Helps Power BI understand the data.
- Clean layout — No merged cells or blank rows.
- Clear headers — Use simple, clear column names.
- One dataset per sheet — Don’t mix unrelated data.
- Separate columns — Keep different types of data in separate columns.
- Name ranges — Use names for important ranges.
This makes importing faster and cleaner.
Implementing Robust Data Type Management
Make sure Power BI knows the correct data types:
- Be consistent — Numbers as numbers, dates as dates.
- Help Power BI — Good formats make detection easy.
- Double check — Verify types in Power BI.
- Use Excel tools — Data validation helps a lot.
- Avoid errors — Good typing prevents formula mistakes.
- Better visuals — Correct data types make charts more accurate.
Good data typing saves headaches later.
Centralized File Management Strategy
Store files smartly to help your Power BI reports:
- Use the cloud — OneDrive and SharePoint work best.
- Name files clearly — Use good names for easy finding.
- Version control — Keep track of file versions.
- Manage access — Only the right people can edit.
- Plan for changes — Communicate when files change.
- Backup — Have backups ready in case of problems.
This avoids broken dashboards or lost data.
Overcoming Common Integration Challenges
Managing File Size and Performance Issues
Large Excel files need tuning for Power BI:
- Filter early — Only import what you need.
- Trim columns — Remove unused columns.
- Split files — Break big files into smaller ones.
- Use relationships — Link small files together in Power BI.
- Monitor speed — Check refresh times.
- Tweak models — Adjust based on file size.
Good tuning keeps things running fast.
Handling Data Refresh Complexities
Refreshing data needs planning:
- Gateway setup — On-premises files need a gateway.
- Watch for changes — Manual edits can break updates.
- Know dependencies — Track what reports rely on which files.
- Have backups — Be ready if a refresh fails.
- Test updates — Test before going live.
- Plan infrastructure — Ensure connections stay strong.
This keeps dashboards fresh and accurate.
Version Control and Governance
Avoid version confusion:
- Use document systems — SharePoint helps manage versions.
- Assign owners — Know who updates each file.
- Approve changes — Review before updating key files.
- Know impact — Track what reports use each file.
- Communicate updates — Let users know about changes.
- Restrict access — Protect files from bad edits.
Good governance avoids bad surprises.
Advanced Integration Techniques
Power BI Dataflows with Excel Sources
Dataflows take Excel-Power BI to the next level:
- Central data prep — Transform data in one place.
- Reusable queries — Use transformations in many reports.
- Better performance — Processing happens in the cloud.
- Stronger control — Manage data prep centrally.
- Scales well — Handles big Excel datasets.
- Team-friendly — Many users can share steps.
Dataflows bring big benefits to Power BI users.
Custom Connectors and API Integration
Advanced users may want extra options:
- Connect Excel Online — Link cloud Excel files.
- Use APIs — Bring in Excel data through web services.
- Build connectors — Create special connectors if needed.
- Automate — Use Power Automate for data tasks.
- Link other tools — Connect Excel through third-party platforms.
- Stream data live — Get real-time Excel updates.
These options support advanced needs.
Must Read: Why Does Excel Crash Frequently? The Complete Guide to Troubleshooting and Prevention
Conclusion
Excel and Power BI work great together. Excel helps with entry and detailed math, while Power BI brings data to life with better visuals and sharing. By planning your integration and following best practices, you can get the most out of both tools and unlock powerful data insights.
