Can I become proficient in Excel without taking a course? Yes, you can get really good at Excel without paying for a course or going to class. Many people ask this question, and after over 25 years of using Excel, I can say for sure that many have learned it well by teaching themselves.
But to truly master Excel, you need more than just watching a few YouTube videos. You need a clear plan and regular practice.
Must Read: How to Customize the Excel Ribbon Toolbar: The Ultimate Guide to Boost Your Productivity
Understanding True Excel Proficiency: Beyond Basic Data Entry
Some people think being good at Excel just means typing in numbers or using simple formulas. But real Excel skills include:
- Handling large amounts of data quickly
- Using advanced formulas that combine many functions
- Solving problems by analyzing data
- Making charts and dashboards to show data clearly
- Creating simple programs called macros to save time
What you need to know depends on your job. A finance expert uses different Excel tools than a project manager or marketer.
Why Self-Learning Excel Often Surpasses Formal Training
Teaching yourself Excel has many benefits over taking a class:
- Go at your own speed – Learn when you have time and focus on hard topics
- Save money – Many great learning tools are free
- Solve real problems – Practice with the tasks you face at work
- Make your own plan – Learn the things that matter most to your job
- Stay self-motivated – Build good study habits on your own
This kind of learning often works better because you’re solving real problems as you go.
Essential Pillars for Successful Excel Self-Learning

Setting Clear, Specific Goals
Before you start learning, know what you want to achieve:
- Decide what you want to do – Like getting ready for a job, automating a task, or improving your data skills
- Break big goals into small steps
- Give yourself time limits for each step
- Pick goals that match your job or current needs
Clear goals help you stay focused and keep learning.
Creating Your Structured Learning Path
Even without a school plan, you can make your own:
- Begin with the basics – Learn how Excel looks and how simple formulas work
- Add harder topics slowly
- Plan which topics to study and for how long
- Spend time on each topic before moving on
This keeps you from feeling lost and makes sure you don’t skip anything important.
Core Excel Fundamentals: Building Your Foundation
Learn these basic skills before moving on:
- How Excel works – Learn the layout, toolbars, and how to move around
- Typing and formatting – Enter data neatly and make it look good
- Cell references – Understand how Excel follows cells (like A1, $A$1)
- Keyboard shortcuts – Speed up your work with quick keys
- Simple formulas – Add, subtract, multiply, and divide
These skills are the base for learning more advanced tools later.
Essential Formulas and Functions Mastery
Basic Statistical Functions
These are must-know functions for any Excel user:
- SUM, AVERAGE, COUNT – Add numbers, find the average, and count items
- MIN, MAX – Find the smallest and biggest values
- MEDIAN, MODE – Find middle or most common values
- STDEV, VAR – Measure how spread out numbers are
Practice using these with different types of data.
Logical Functions for Decision Making
These functions help Excel make choices:
- IF – Tells Excel what to do if something is true or false
- AND, OR – Use more than one condition
- Nested IFs – Use IF inside another IF for complex checks
- IFERROR, IFBLANK – Handle empty cells or errors in data
These are useful for reports and smart data setups.
Lookup Functions for Data Retrieval
These help find data in large spreadsheets:
- VLOOKUP – Finds data in a column
- INDEX-MATCH – A better way to search than VLOOKUP
- XLOOKUP – A newer tool that’s flexible and powerful
- HLOOKUP – Searches rows instead of columns
These are key tools when you work with big sets of data.
Text Functions for Data Cleaning
These fix messy text data:
- CONCATENATE / & – Join text from different cells
- LEFT, RIGHT, MID – Get parts of words or numbers
- TRIM, CLEAN – Remove extra spaces or strange characters
- FIND, LEN – Find letters and count how many there are
These help clean up data before using it in charts or reports.
Data Management and Organization Excellence
Sorting and Filtering Techniques
Make messy data easier to read:
- Single-level sorting – Sort by one column, like names A–Z
- Multi-level sorting – Sort by more than one thing
- AutoFilter – Show only the data you need
- Advanced filtering – Use custom rules to filter data
These tools help you quickly find what you’re looking for.
Data Validation and Quality Control
Make sure data entered is correct:
- Dropdown lists – Let users pick from set choices
- Input limits – Only allow certain numbers or formats
- Custom rules – Make rules that fit your business
- Error messages – Show a warning if something is wrong
This keeps your spreadsheets clean and accurate.
Data Cleaning and Preparation
Fix problems in raw data:
- Remove duplicates – Get rid of repeated data
- Flash Fill – Fill in patterns automatically
- Text to Columns – Split text into separate cells
- Find and Replace – Fix many mistakes at once
These save lots of time and make data ready to use.
Advanced Data Analysis Capabilities

PivotTable Mastery
PivotTables help analyze large sets of data:
- Make basic PivotTables – Pick your rows, columns, and values
- Change fields – Move data around in the table
- Group data – Organize by time or number ranges
- Create new fields – Add your own formulas
- Format for reports – Make it look good for sharing
PivotTables help answer tough questions fast.
Advanced PivotTable Techniques
Take PivotTables further:
- Slicers and timelines – Let users filter data interactively
- Combine ranges – Use data from many sheets
- Custom calculations – Add new data inside fields
- PivotCharts – Show PivotTable data as charts
These tools make your reports dynamic and easy to explore.
Data Visualization and Chart Creation
Essential Chart Types
Charts help you tell a story with data:
- Bar and column charts – Compare numbers across items
- Line charts – Show trends over time
- Pie charts – Show parts of a whole
- Scatter plots – Show relationships between numbers
- Combo charts – Mix different chart types
Pick the right chart to make your message clear.
Advanced Visualization Techniques
Make your charts smarter and better-looking:
- Dynamic charts – Update automatically when data changes
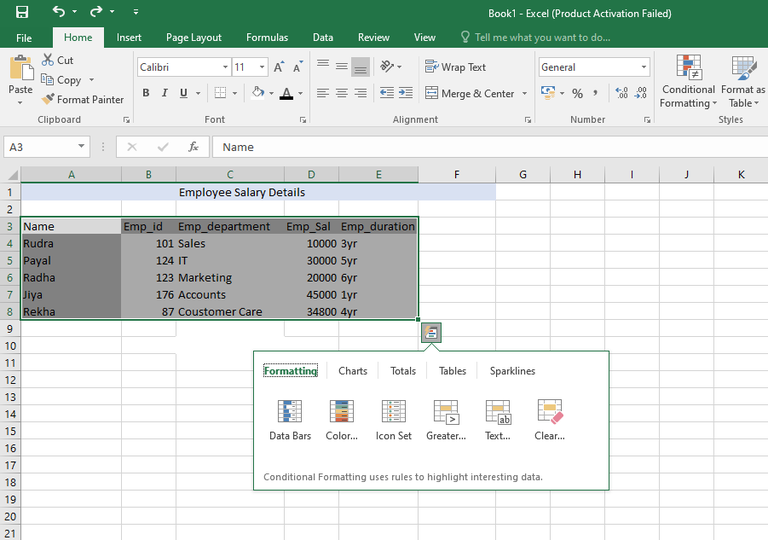
- Conditional formatting – Use colors to highlight key info
- Sparklines – Small charts inside a cell
- Custom styles – Match charts to your company look
These help you impress others with clean, smart visuals.
Recommended Free Resources for Self-Learners

Microsoft’s Official Learning Platform
Free help from Microsoft:
- Microsoft Learn – Free tutorials and practice lessons
- Help button (F1) – Quick help for tools and functions
- Smart tips – Help that shows up as you work
- Office support site – Full guides and answers
These are updated often and are great for learning the right way.
YouTube Channels and Video Learning
Watch and learn from Excel experts:
- Leila Gharani – Advanced tricks and real work tips
- ExcelIsFun – Lessons for all skill levels
- Chandoo.org – Focus on dashboards and visuals
- Excel Campus – Easy tips and practical examples
Pick recent videos to make sure they match the newest Excel versions.
Online Communities and Forums
Ask questions and get help:
- Reddit (r/excel) – Ask anything and learn from others
- MrExcel forums – Get expert advice
- Stack Overflow – For tough coding questions
- Microsoft Tech Community – Get help straight from Microsoft and users
These places are great for feedback and learning new tricks.
Overcoming Common Self-Learning Challenges
Managing Information Overwhelm
Excel has a lot to learn, but you can manage it:
- Learn one skill at a time and practice it
- Make a list of what to learn based on your job
- Go back to the basics if you get stuck
- Build your confidence slowly with small wins
Strong basics make harder topics easier later.
Maintaining Motivation and Discipline
Keep going even when learning feels hard:
- Set small, daily goals
- Track your progress and reward yourself
- Find a study partner or join a group
- Practice often – even 15 minutes a day helps
Learning a little every day is better than long sessions once in a while.
Getting Feedback Without Formal Instruction
Check your progress and improve:
- Compare your work with examples online
- Study how experts solve problems
- Ask questions in forums or groups
- Try different ways until you find what works
Getting feedback from others can make a big difference.
Advanced Excel Skills for Career Growth
Automation and Macro Development
Save time by letting Excel do the work:
- Record macros – Make Excel do tasks for you
- Use the VBA editor – Start editing simple code
- Change small parts – Tweak code to fit your needs
- Handle errors – Make your macros more reliable
These tools help you work faster and stand out at work.
Professional Dashboard Creation
Make top-level reports for leaders:
- Interactive dashboards – Let users click to explore
- KPI charts – Show key numbers clearly
- Tell a story – Show what the data means
- Clean design – Make it look professional
Dashboards show you’re not just using Excel – you’re leading with it.
Creating Your Personal Learning Schedule
Daily Practice Routine
Practice regularly to keep getting better:
- Morning – Practice for 15–30 minutes
- Lunch – Watch a quick video or review a function
- Evening – Try what you’ve learned on your own data
- Weekend – Spend time on harder topics
The more you practice, the more confident you become.
Weekly Learning Goals
Plan each week to stay on track:
- Weeks 1–2 – Learn the basics
- Weeks 3–4 – Focus on functions
- Weeks 5–6 – Work on data tools
- Weeks 7–8 – Try PivotTables and charts
Change the schedule based on how fast you learn.
Measuring Your Progress and Success
Skill Assessment Benchmarks
See how far you’ve come:
- Beginner – Use the basics and simple formulas
- Intermediate – Use lookups and PivotTables
- Advanced – Build dashboards and write macros
- Expert – Teach others and solve big problems
Check your level often to see what’s next to learn.
Real-World Application Projects
Use your skills in real ways:
- Track your money – Budget and spending
- Automate reports – Save time at work
- Analyze data – Get useful insights
- Build dashboards – Share your work with others
Projects help prove your skills and make learning fun.
Must Read: Can Excel Connect to Databases? The Ultimate Guide to Database Integration in 2025
Conclusion: Your Path to Excel Mastery Starts Today
Can you become good at Excel without taking a course? Yes – and often, self-learners do even better than classroom students. The key is to stay committed, practice often, and use the many free tools available.
Make a learning plan, set goals, and practice with real projects. Use free resources, join online communities, and keep learning one step at a time.
Remember, Excel skills grow slowly with daily effort. Celebrate your progress, fix your mistakes, and stay curious. Your journey to Excel mastery can start today – just take that first small step!

