

Power Query is a powerful feature in Microsoft Excel that helps you get, clean, and shape data quickly and easily.
Whether you have data in different files, databases, or websites, Power Query can bring it all together, fix messy parts, and prepare it for analysis.
In this article, we’ll explore what Power Query is, why it matters, and how you can start using it today—explained in simple, clear language so that even a fifth grader can follow along.
Must Read: How to Use INDEX and MATCH in Excel – Step-by-Step Guide
What Is Power Query?
At its core, Power Query is a data connection and transformation tool built into Excel. With Power Query, you can:
- Extract data from many different sources, like CSV files, Excel workbooks, web pages, or databases.
- Transform that data by cleaning, filtering, sorting, merging, or changing formats.
- Load the cleaned data back into Excel as a table or data model ready for analysis (e.g., with PivotTables or charts).
Power Query calls its transformation steps “queries.” Each query records exactly what you do—step by step—so you can apply the same process again and again without redoing the work.
Why Use Power Query?
Before Power Query, cleaning and combining data in Excel often meant writing long formulas, using manual steps, or recording macros. This could be slow, error-prone, and hard to update when your source data changed. Power Query solves these problems by:
- Automating repetitive tasks
Once you set up a query, refreshing it pulls in new data and reapplies your cleaning steps automatically. - Reducing errors
Each step is recorded in a clear, visual list. If something goes wrong, you can edit, remove, or reorder steps. - Handling large data
Power Query is optimized to work with large tables much faster than dragging formulas through thousands of rows. - Connecting to multiple data sources
Instead of copying and pasting data from different places, you can point Power Query to each source and combine them in one go.
Where to Find Power Query in Excel
Power Query features have been built into Excel since the 2016 version under the “Get & Transform” section on the Data tab. Depending on your Excel version, you’ll see:
- Excel 2016 and later:
On the Data tab, look for Get Data, Get & Transform Data, or Get Data → From File/From Web/From Database. - Excel 2010 and 2013:
Power Query is available as a free add-in. Install the add-in, and you’ll get a Power Query tab on the ribbon.
If you don’t see these options, you may need to update Excel or install the Power Query add-in.
Key Features of Power Query
Power Query offers many features to make data work easier. Here are some of the most important:
- Data Connectors
Pre-built connectors let you pull data from files (Excel, CSV, XML), databases (SQL Server, Oracle, MySQL), cloud services (SharePoint, Azure), web pages, and more. - Applied Steps Pane
Every transform action you perform is listed in order. You can click any step to view or edit it, drag to reorder, or remove steps you don’t need. - Data Profiling Tools
Simple charts and statistics help you understand your data at a glance: how many values are errors, blank, or unique. - Transformations
Common transformations include removing rows, choosing columns, splitting or merging columns, changing data types, pivoting/unpivoting columns, grouping data, and filling down/up. - M Formula Language
Under the hood, Power Query uses a language called “M”. You don’t need to learn M to use Power Query, but you can write or edit M code in the Advanced Editor to handle complex scenarios. - Query Folding
When you connect to a database, Power Query tries to push transformation steps back to the source system. This means less data is pulled into Excel and operations run faster on the database side. - Combine Files from a Folder
With a single click, Power Query can grab all files from a folder that share the same structure (like monthly reports) and stack them into one table.
How to Start with Power Query: Step-by-Step Guide
Here’s a simple walkthrough to import and clean a CSV file:
- Open Excel and go to the Data tab.
- Click Get Data → From File → From Text/CSV.
- Browse to your CSV file and click Import.
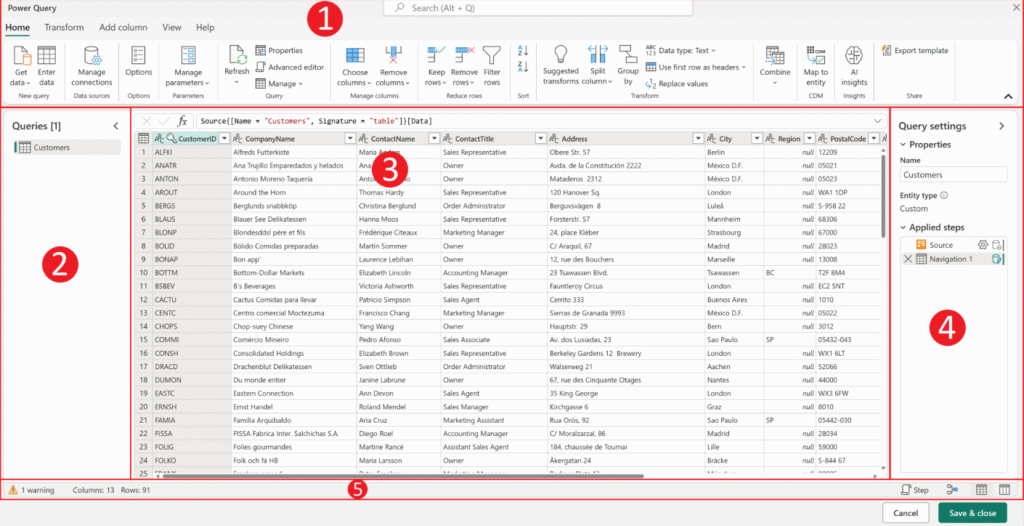
- In the preview window, click Transform Data to open the Power Query Editor.
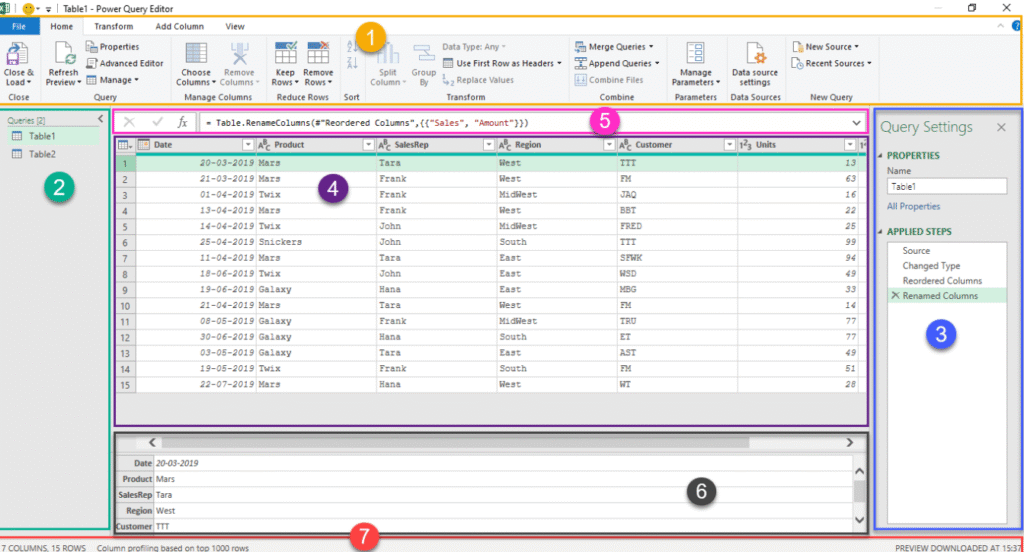
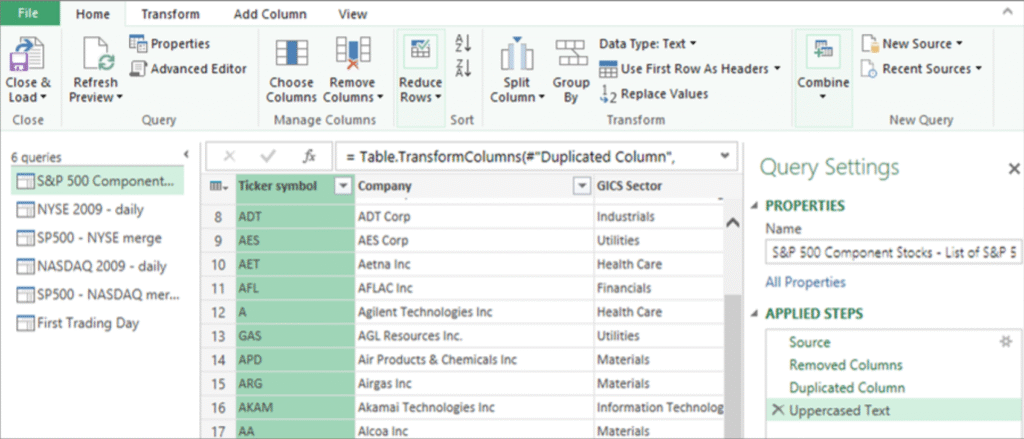
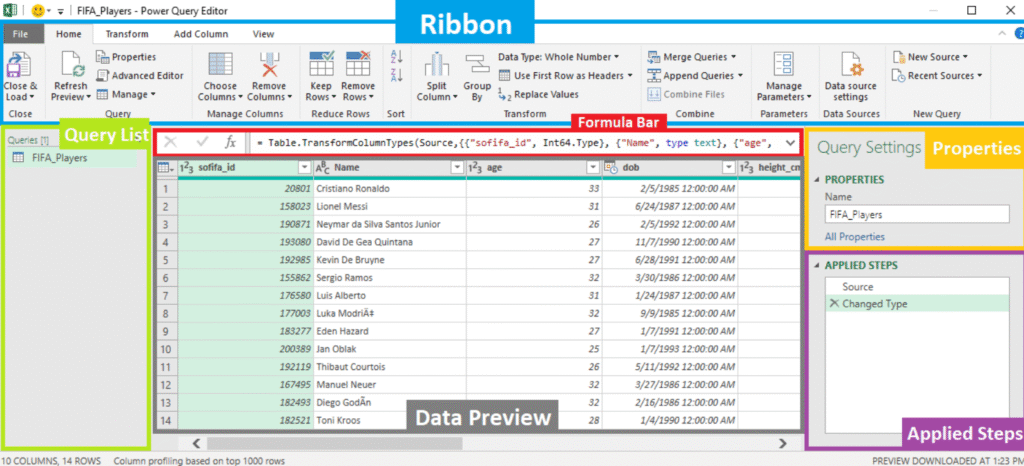
- In the Editor, you’ll see your data and the Applied Steps pane on the right.
- Change data types: Click the icon next to each column header to select the correct type (e.g., Text, Whole Number, Date).
- Remove unwanted columns: Right-click a column header and choose Remove.
- Filter rows: Click the filter button on a column to exclude blank or unwanted values.
- Rename columns: Double-click a column header and type a new name.
- When you’re done, click Close & Load to bring the result back into Excel as a new table.
Each of these actions appears as a step in the Applied Steps pane. When your source file is updated, simply right-click your table in Excel and choose Refresh, and Power Query will reapply all steps.
Example: Combining Data from Multiple Tables
Imagine you have quarterly sales data in four Excel files: Q1.xlsx, Q2.xlsx, Q3.xlsx, and Q4.xlsx. Each has the same columns but different rows. Here’s how to combine them:
- Place all four files in one folder.
- In Excel, go to Data → Get Data → From File → From Folder.
- Select the folder containing the files and click OK.
- In the preview of files, click Combine → Combine & Transform Data.
- Power Query will sample the first file to detect the structure.
- In the Query Editor, you’ll see a new table that stacks all rows from Q1–Q4.
- Apply any cleaning steps if needed (e.g., change data types, rename columns).
- Click Close & Load to get one combined table in Excel.
Now you have all four quarters in one place, ready for PivotTables, charts, or further analysis—all with a single refresh.
Example: Cleaning Messy Data
Suppose you downloaded a table from a website, but it has extra header rows and footers, mixed date formats, and blank cells:
- Remove top rows: In Power Query, choose Home → Reduce Rows → Remove Rows → Remove Top Rows, then enter how many.
- Remove bottom rows: Similarly, choose Remove Bottom Rows to cut off footers.
- Fill down: If some cells in a column are blank but should copy the value from above, click Transform → Fill → Down.
- Split a column: If a column has “City, State” in one cell, select it, choose Split Column → By Delimiter, pick comma, and you get two columns.
- Standardize dates: Click the date column’s data-type icon and pick Using Locale to convert text dates into Excel dates.
These simple clicks can clean messy data in seconds—no complex formulas needed.
Advanced Topic: Editing M Code
While most tasks can be done with clicks, sometimes you need custom logic. The Advanced Editor shows the M code behind your query:
mCopyEditlet
    Source = Csv.Document(File.Contents("C:\Data\sales.csv"), [Delimiter=",", Columns=5, Encoding=1252, QuoteStyle=QuoteStyle.None]),
    #"Promoted Headers" = Table.PromoteHeaders(Source, [PromoteAllScalars=true]),
    #"Changed Type" = Table.TransformColumnTypes(#"Promoted Headers",{{"Date", type date}, {"Amount", type number}})
in
    #"Changed Type"
You can paste in functions, loop through lists, or write conditional logic—giving you the power of a full programming language if you need it.
Must Read: What Is the Use of CONCATENATE in Excel? | BestExcelTips
Best Practices for Power Query
- Name your queries clearly (e.g., “Sales_Cleaned” instead of “Query1”).
- Document your steps by adding comments in M code or by adding descriptive names to steps.
- Group related queries in folders (right-click in the Queries pane).
- Limit preview rows in large datasets: Click File → Options → Data → Data Preview and reduce the number for faster editing.
- Use parameters for file paths or filter values so you can change them in one place.
- Avoid loading intermediate queries: Disable load for helper queries by right-clicking and unchecking Enable Load.
Conclusion
Power Query transforms Excel from a spreadsheet program into a powerful, repeatable data-shaping tool.
With its easy-to-use interface, built-in connectors, and automation features, you can save hours of manual work and focus on the insights that matter.
Whether you’re cleaning data, combining reports, or connecting to live databases, Power Query is an essential skill for anyone working with data in Excel.
FAQs
What is Power Query best used for?
Power Query is best used for extracting, transforming, and loading (ETL) data. Common tasks include:
1. Pulling data from various sources (files, databases, web).
2. Cleaning or shaping data (removing unwanted rows, fixing formats).
3. Combining multiple tables or files into one.
4. Automating data refreshes so you don’t have to redo manual steps.
Is Power Query same as Excel?
No. Power Query is a feature within Excel (and other Microsoft tools) that specializes in data preparation. While Excel itself offers formulas and functions, Power Query provides a dedicated, visual ETL environment that records your actions as steps and automates the process. Think of Excel as your canvas for calculations and charts, and Power Query as your workshop for getting the materials ready.
Is Power Query an ETL tool?
Yes. ETL stands for Extract, Transform, Load. Power Query performs all three:
1. Extract: Connects to data sources.
2. Transform: Applies cleaning and shaping steps.
3. Load: Outputs the final table into Excel or the Excel Data Model for analysis.
What is a Power Query function?
A Power Query function is a reusable piece of M code that performs a specific task—similar to functions in Excel formulas. You can use built-in functions (e.g., Table.SelectRows, Text.Split) or write custom functions in the Advanced Editor to encapsulate logic. Functions take inputs (parameters) and return values, making your queries more modular and easier to maintain.
