

Learning Excel can open up a world of cool opportunities. It’s more than just a spreadsheet tool—it’s a smart way to get ahead in school, work, or even in your daily life.
Whether you’re just starting out, already working, or just want to get better at handling numbers and data, learning Excel can help you do things faster and smarter. You can use it to sort information, solve problems, and show what you know in a clean, easy way.
But the hard part isn’t deciding if you should learn Excel—it’s knowing how to start. There are tons of videos, courses, and books out there, and that can feel super overwhelming. Many people quit before they even open a blank Excel sheet.
That’s why we made this easy-to-follow guide. It will help you learn Excel step by step. You’ll start as a beginner and finish feeling confident and ready to use Excel for school, work, or personal projects.
Must Read: What’s the difference between Excel desktop and Excel web? A Complete Guide 2025-2026
Why Excel Mastery Matters More Than Ever
The Universal Language of Business
Excel is like the common language people use in the business world. Big companies and small businesses all use it to plan, track, and manage their work. From money math to organizing tasks, Excel is used everywhere.
Did you know more than 80% of job ads say that knowing Excel is a must or a big plus? And it’s not just for math jobs. People in marketing use it to follow ad results, HR teams use it for staff info, and even creative people use it to manage budgets and timelines.
Excel is also helpful at home. You can use it to keep track of your money, plan workouts, or even make checklists for events. Once you see what Excel can do, you’ll find ways to use it every day.
Breaking Down Common Barriers
Some people are scared to learn Excel because they think it’s too hard or they’re “not good at math.” But the truth is, you don’t need to be a math whiz. Excel is really about spotting patterns and thinking clearly.
Over time, Excel has gotten easier to use. Today, it gives you hints for formulas, checks your work, and has ready-made templates to help you get started. The trick is to have the right attitude and follow a clear learning path.
Some think knowing just the basics is enough. But learning more than the basics saves tons of time and helps you solve bigger problems. Once you know more, you can do things in minutes that used to take hours. That’s the real power of Excel.
Foundation Building: Mastering the Basics
Understanding Excel’s Architecture
Before using formulas or tools, it’s important to know how Excel works. An Excel file is called a workbook. Inside, there are worksheets made of rows (numbered) and columns (lettered). Each box is called a cell and has a name like A1 or B5.
At the top is the ribbon with tabs like Home, Insert, and Data. These tabs have buttons for different actions. The Formula Bar lets you see or change what’s in a cell. The Name Box shows the name of the active cell. The Status Bar gives quick info, like sums and averages.
Knowing this setup helps you avoid confusion later. Click around and check what each tab and button does. This base knowledge will help you learn faster as you go.
Data Entry and Manipulation Fundamentals
Typing in data is a big part of using Excel. You’ll work with text, numbers, dates, and formulas. Excel treats each type differently, so knowing the difference helps you avoid mistakes.
Learn to use the AutoFill handle—that little square at the bottom-right of a cell. It helps you copy patterns, like numbers or dates, and speeds up your work. Also, shortcuts for copy, cut, and paste save lots of time.
Don’t forget about Paste Special. It’s more than regular paste. It lets you paste only values, formats, or formulas. This is super helpful when you’re mixing data from different places or trying to keep your format the same.
File Management and Data Organization
Managing your Excel files the right way saves you time. Learn the file types: .xlsx is the newest, .xls is for old versions, and .csv works with many apps. Pick the one that fits your job best.
Name your files clearly and use dates so you can track versions. Make folders to keep things neat. These habits are key when you handle lots of projects or work with others.
Inside your worksheet, use clear titles and keep your data tidy. Separate raw data from your calculations. Use different sheets for different parts of a project. This keeps your work easy to follow and understand.
Core Functionality: Making Excel Work for You
Essential Formulas and Functions
The real power of Excel comes from its formulas and functions. Every formula starts with an equals sign (=), then a function name, and stuff in parentheses. This is true for simple math and big formulas. Start with basic ones like:.
- SUM adds numbers,
- AVERAGE finds the middle,
- COUNT counts how many cells have numbers,
- MIN and MAX find the lowest and highest.
These are great for most jobs and help you build harder ones later.
Also, learn about cell references. A1 is a relative reference—it changes if you copy it. $A$1 is absolute—it stays the same. $A1 or A$1 are mixed, which helps in special cases. Knowing this helps your formulas work right.
Formatting for Professional Presentation
Formatting makes your data look neat and easy to read. Excel has lots of tools for this, but simple and clean is best. Make it easy to spot what matters most.
Use number formats to make data clear. Use currency for money, percent for ratios, and date format for time info. Excel can guess some, but it’s better to set it yourself to stay consistent.
Use borders and shading to organize things. Borders separate sections; shading can highlight headers or totals. Use soft colors and not too much bold style. Simple formatting often looks more pro.
Data Organization with Sorting and Filtering
Sorting and filtering let you explore data without changing it. Sorting can put items in A–Z or 1–100 order. You can even sort by more than one thing, like name and date. Knowing how Excel sorts helps avoid surprises.
Filters help you see only what you need. You can filter by values, text, or number ranges. You can use more than one filter at once, but don’t forget to remove them when sharing files.
You can also use advanced filters for harder tasks. You can find top or bottom values or filter by special rules. These tools help you focus on what matters and make reports faster.
Intermediate Skills: Efficiency and Analysis
Named Ranges for Easier Reference
When you give a cell or group of cells a name, it’s easier to use them in formulas. Instead of writing =SUM(A1:A10), you can write =SUM(Sales). This makes your formulas easier to read and understand.
You can name a single cell or a group. Go to the Name Box near the top-left of Excel. Type a name, and press Enter. You can also use the Formulas tab and pick Name Manager to make or change names. Use names like “Revenue” or “TaxRate” to stay clear.
Named ranges help when your workbook has lots of data or formulas. They keep things clean and save time when editing later.
Data Validation for Accurate Input
Data validation helps stop typing mistakes. It sets rules for what can go in a cell. You can let only numbers, dates, or a set list of words. This keeps your data clean and right.
To set this up, pick a cell, go to the Data tab, and click Data Validation. Choose the rule type, like whole numbers between 1 and 100, or a drop-down list of options. You can also add a message to guide users.
This tool is great when others use your file. It avoids wrong info and keeps everything the way you want it.
Conditional Formatting for Visual Clarity
Conditional formatting changes how a cell looks based on its value. It makes data easier to read. For example, you can make high scores green and low scores red.
You can add rules like:
- Highlight Cells Greater Than 100
- Color Scales that shade numbers from low to high
- Data Bars to show values as bars right in the cell
This helps patterns and problems stand out. Just don’t overdo it—too many colors can make it hard to follow. Use it to guide the eye to what matters most.
Visualization and Communication
Charts and Visual Communication
Charts help turn numbers into pictures. This makes them easier to understand. They show trends, compare data, and help others see what’s going on.
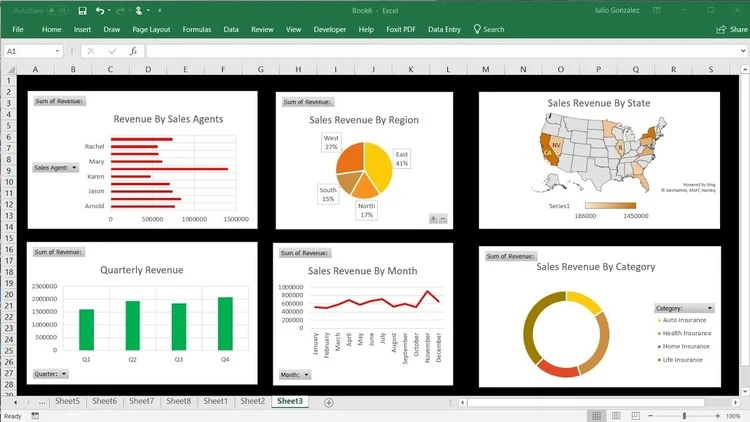
Pick a chart based on what you want to show:
- Use Column Charts to compare things
- Use Line Charts to show trends over time
- Use Pie Charts to show parts of a whole (but don’t use too many)
- Use Scatter Charts to show how things are related
Select your data carefully. Pick only what matters. Excel’s chart tool gives suggestions, but knowing which chart works best helps you tell your story clearly.
Make your chart look clean. Use clear labels, easy colors, and good spacing. Take out things like extra lines or too many legends. The goal is to help people understand your data fast—even if they haven’t seen the chart before.
PivotTables: The Game Changer
PivotTables are one of Excel’s best tools. They quickly summarize big groups of data. You can spot trends and patterns in seconds. One PivotTable can do the work of many formulas.
Start with clean data in a table. Make sure each column has a clear name, and all data is in the same format. Then go to the Insert tab and click PivotTable.
The PivotTable has four parts:
- Rows: group your data
- Columns: make categories
- Values: show totals or counts
- Filters: pick what to include
Drag and drop fields into each area. You can try different views until you get what you need. PivotTables help turn messy data into answers fast.
Learning Strategies for Success
Hands-On Practice Methodology
Watching videos helps, but doing the work is better. You learn Excel by using it. Practice makes you faster and smarter.
Make your own practice files. Pick topics you like—like sports, school work, or money. Try tracking your chores or saving plans in Excel. Use real data that matters to you. This keeps learning fun.
Start simple. Try a few formulas. Then slowly add new tools. As you practice, your skills will grow. You’ll feel proud when you solve problems on your own.
Resource Utilization and Continuous Learning
Excel has built-in help. Press the F1 key to open it. You’ll find tips, how-tos, and examples.
The internet is also full of help. Check places like Reddit’s r/excel or Stack Overflow. You can ask questions or just read what others are doing.
Books and online classes help too. Pick ones that match how you learn. Some are short and focused. Others are long and deep. Choose what works for you and your goals.
Problem-Solving Mindset Development
Learning Excel isn’t just about knowing tools. It’s about thinking clearly. Break big problems into small steps. This makes them easier to solve.
Try different ways to solve one problem. Excel gives you many paths. This helps you think better and faster.
If you see an error—don’t stress. Learn from it. Common errors like #DIV/0!, #N/A, or #REF! have fixes. When you solve them, you grow stronger and more confident.
Advanced Horizons: Future Learning Paths
Power Tools Overview
Excel has powerful add-ons called Power Query, Power Pivot, and Power BI. These tools help you handle really big data and do smart analysis.
Power Query cleans and changes data from many places. Power Pivot lets you build complex data models for deep analysis.
These tools link Excel to bigger data systems. Learning them can open new jobs in data and business intelligence.
They take time to learn, but knowing they exist helps you see when you need more than just basic Excel.
Automation and Customization
Macros and VBA (Visual Basic for Applications) let you automate tasks in Excel. They can do repetitive jobs for you or create custom tools inside Excel.
Learning VBA takes effort but gives you great power. Start by recording simple macros. This helps you understand how automation works.
Automation saves time when you do the same work often. But don’t automate tasks you do only once or twice.
Must Read: 271+ Simple Community Art Project Ideas For Students
Conclusion: Your Excel Journey Starts Now
Learning Excel is like going on a journey. You start with simple things like typing in data, and move on to big things like charts, PivotTables, and even automation. This takes time, practice, and patience—but it’s totally worth it.
Getting good at Excel can help you do better in school, at work, or in your own projects. You’ll save time, make smart choices, and work more easily with numbers and data.
The best way to learn Excel is to practice. Don’t wait until you feel “ready.” Start now with small projects. Each new skill you learn makes the next step easier.
Remember, Excel is always changing and getting new features. Keep learning, stay curious, and try new things.
You don’t need to be a tech expert to master Excel. Just take one step at a time. Start with one cell, one formula, or one chart. That’s all it takes to begin.
Excel is more than just software—it’s a skill that can help you grow. So go ahead and take that first step today!
